
Emphasized
About this page
The major weather centres use ensembles to help them to quantify the inherent uncertainties in Numerical Weather Prediction (NWP.)This page sets out to help sailors to understand what ensembles really show.
Related pages
On this page -
Introduction
There are many sources of NWP output available in GRIB but relatively few models. ECMWF, US GFS and DWD ICON, are the main ones readily available and used. All global models use the same equations to calculate how the atmosphere works and all use the same data. However, there are small differences in models and in data analysis programs that start off the forecast.
Ensembles
Each centre runs forecasts using the combination of model formulation and analysis process that they find works best for their purposes. This is the deterministic forecast and the one that will be regarded as the �best guess,� In parallel with each forecast, the model is run many times using a degraded resolution but with slightly different analyses.
One way of seeing the effects of running model ensemble is to visit the Meteociel.fr site. They have a number of displays including, among others, the US GFS and ECMWF ensembles.
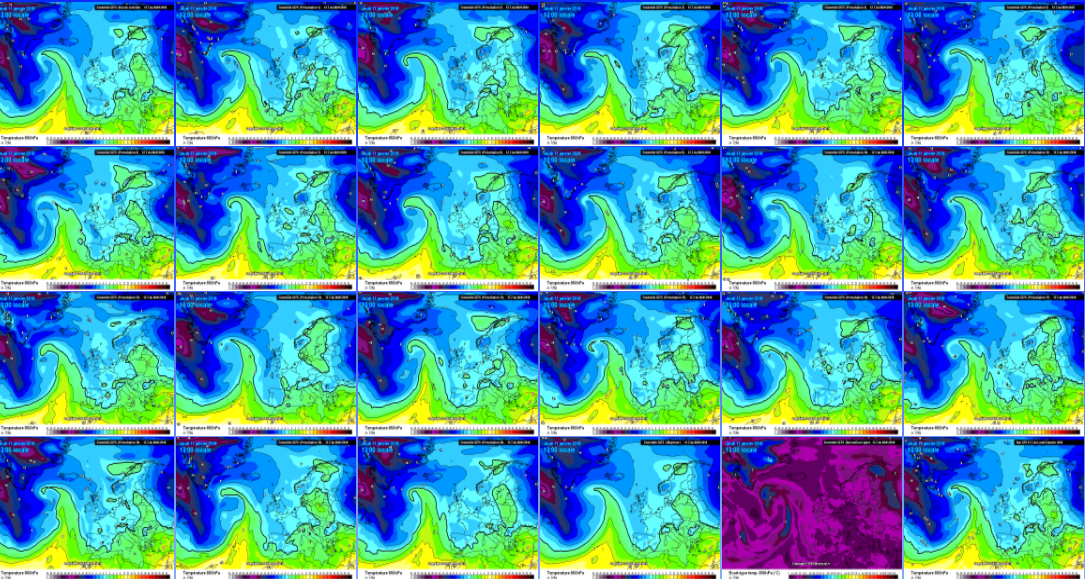
Ensemble of 20 72-hour forecasts. The bottom right is the deterministic forecast.
Clearly there are broad similarities with small differences between ensemble members. But, of course, the devil is in the detail and this display is not very useful to us as sailors.
Rather more informative is a tabular_ display of 10m winds. Meteociel uses km/hour.
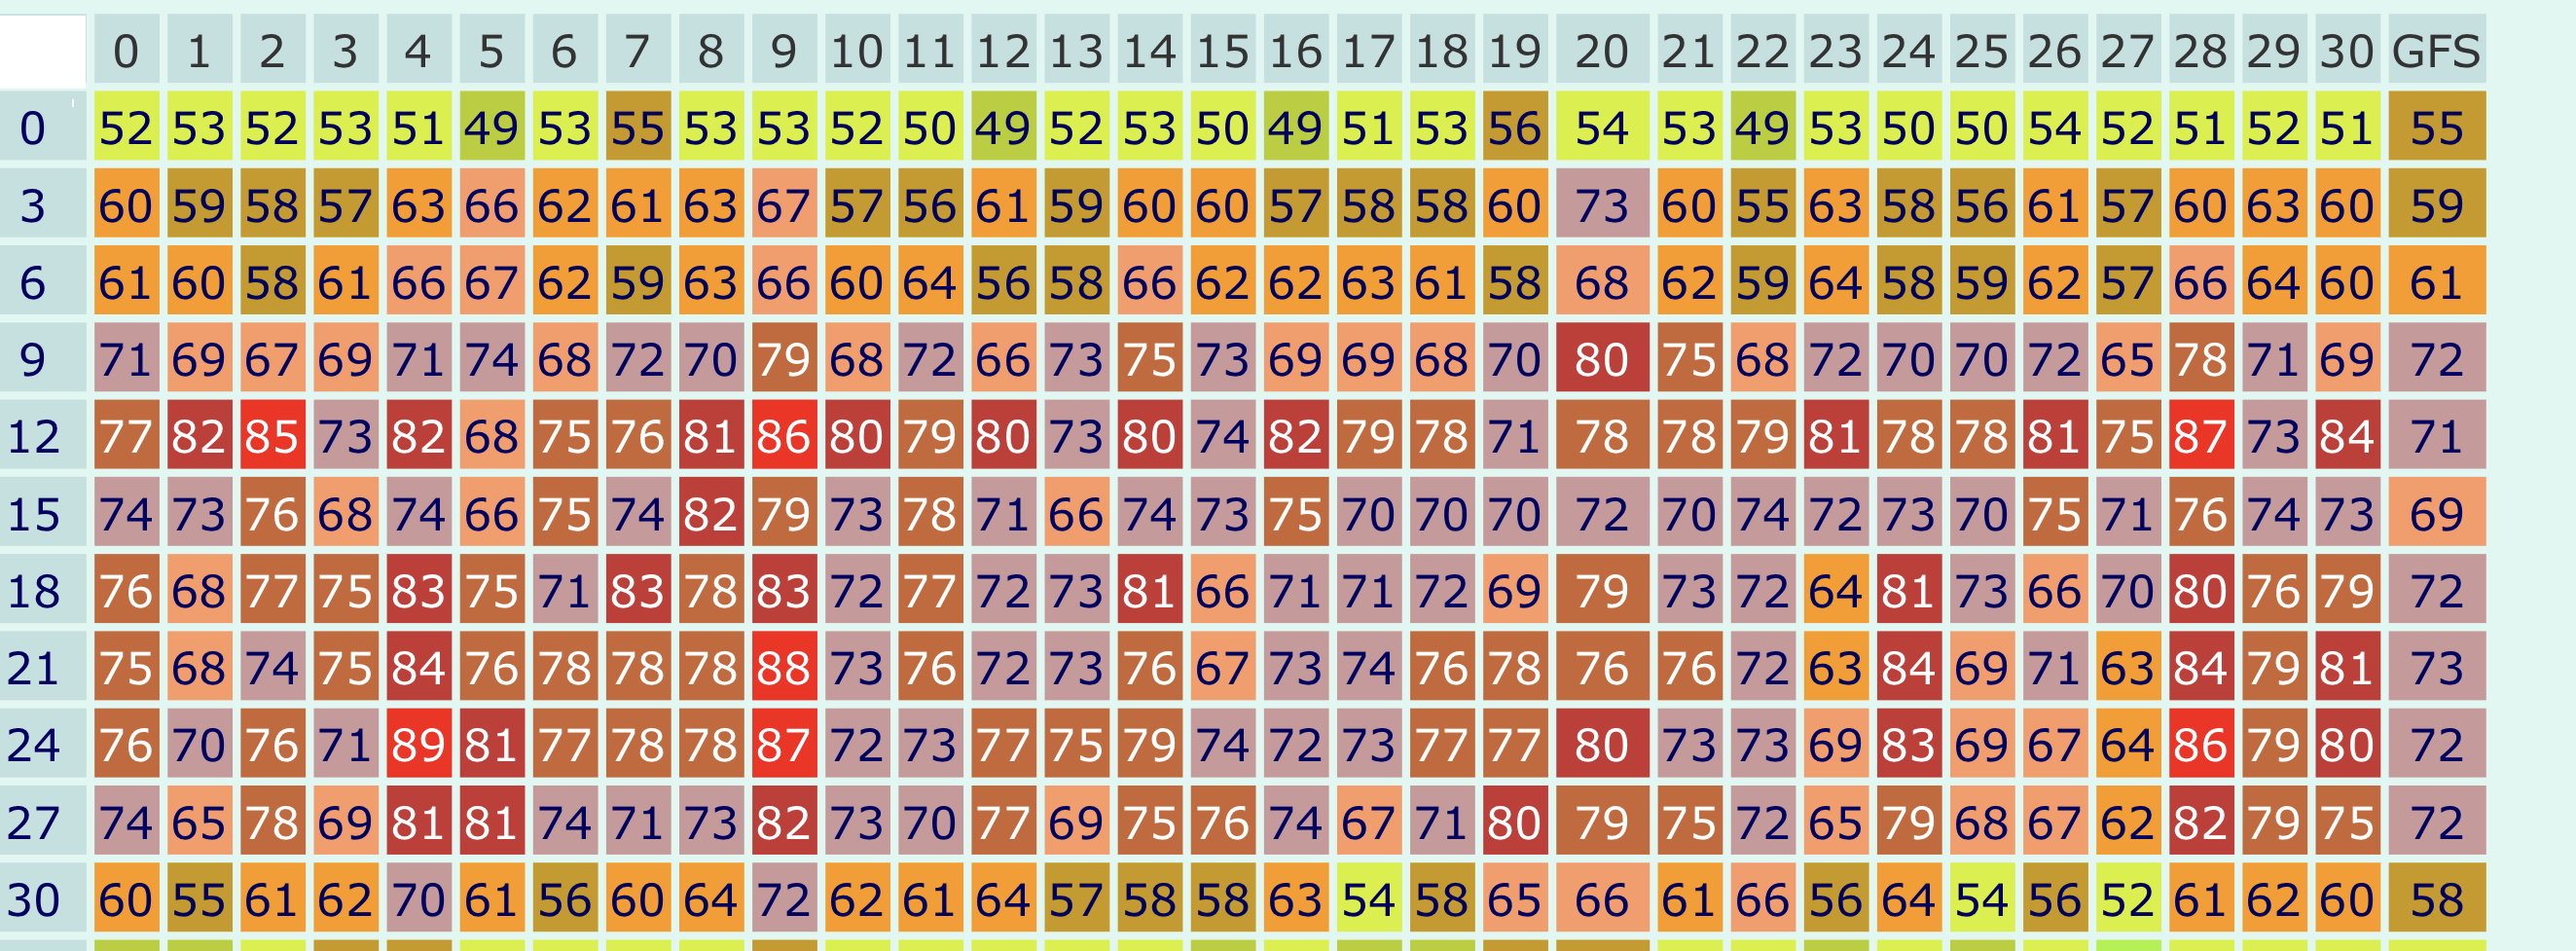
GFS 30-member ensemble wind speeds for a point in the North Sea. Speeds are in km/hr. Roughly, 4 km/hr= 2 knot = 1 m/sec. The GFS deterministic forecasts are in the far-right hand column, the other columns show the 20 ensemble forecasts.
At 24 hours, the GFS forecast, far right-hand column, was for a speed of 39kn (72 km/hour). The ensemble forecasts ranged from 35-44kn (64-82km/h) � bottom of F8 to middle of F9.
Watching a series of these ensemble results shows, that there is no such animal as a precise or accurate forecast. On some occasions the spread in the data can be large, implying greater uncertainty in the outcome. On other occasions the spread can be small thus giving confidence in the deterministic forecast.
Ensembles do not provide alternative forecasts for the users to pick and choose which one they like best. They are simply an indication of confidence in a forecast. In principle, the ensemble approach could be used if many model outputs were available. In practice, we can only easily, look at output from a small selection of models. Some apps, Ventusky and WeatherTrack show several forecasts but the Windy.com website and app is a particularly useful facility for comparing models.
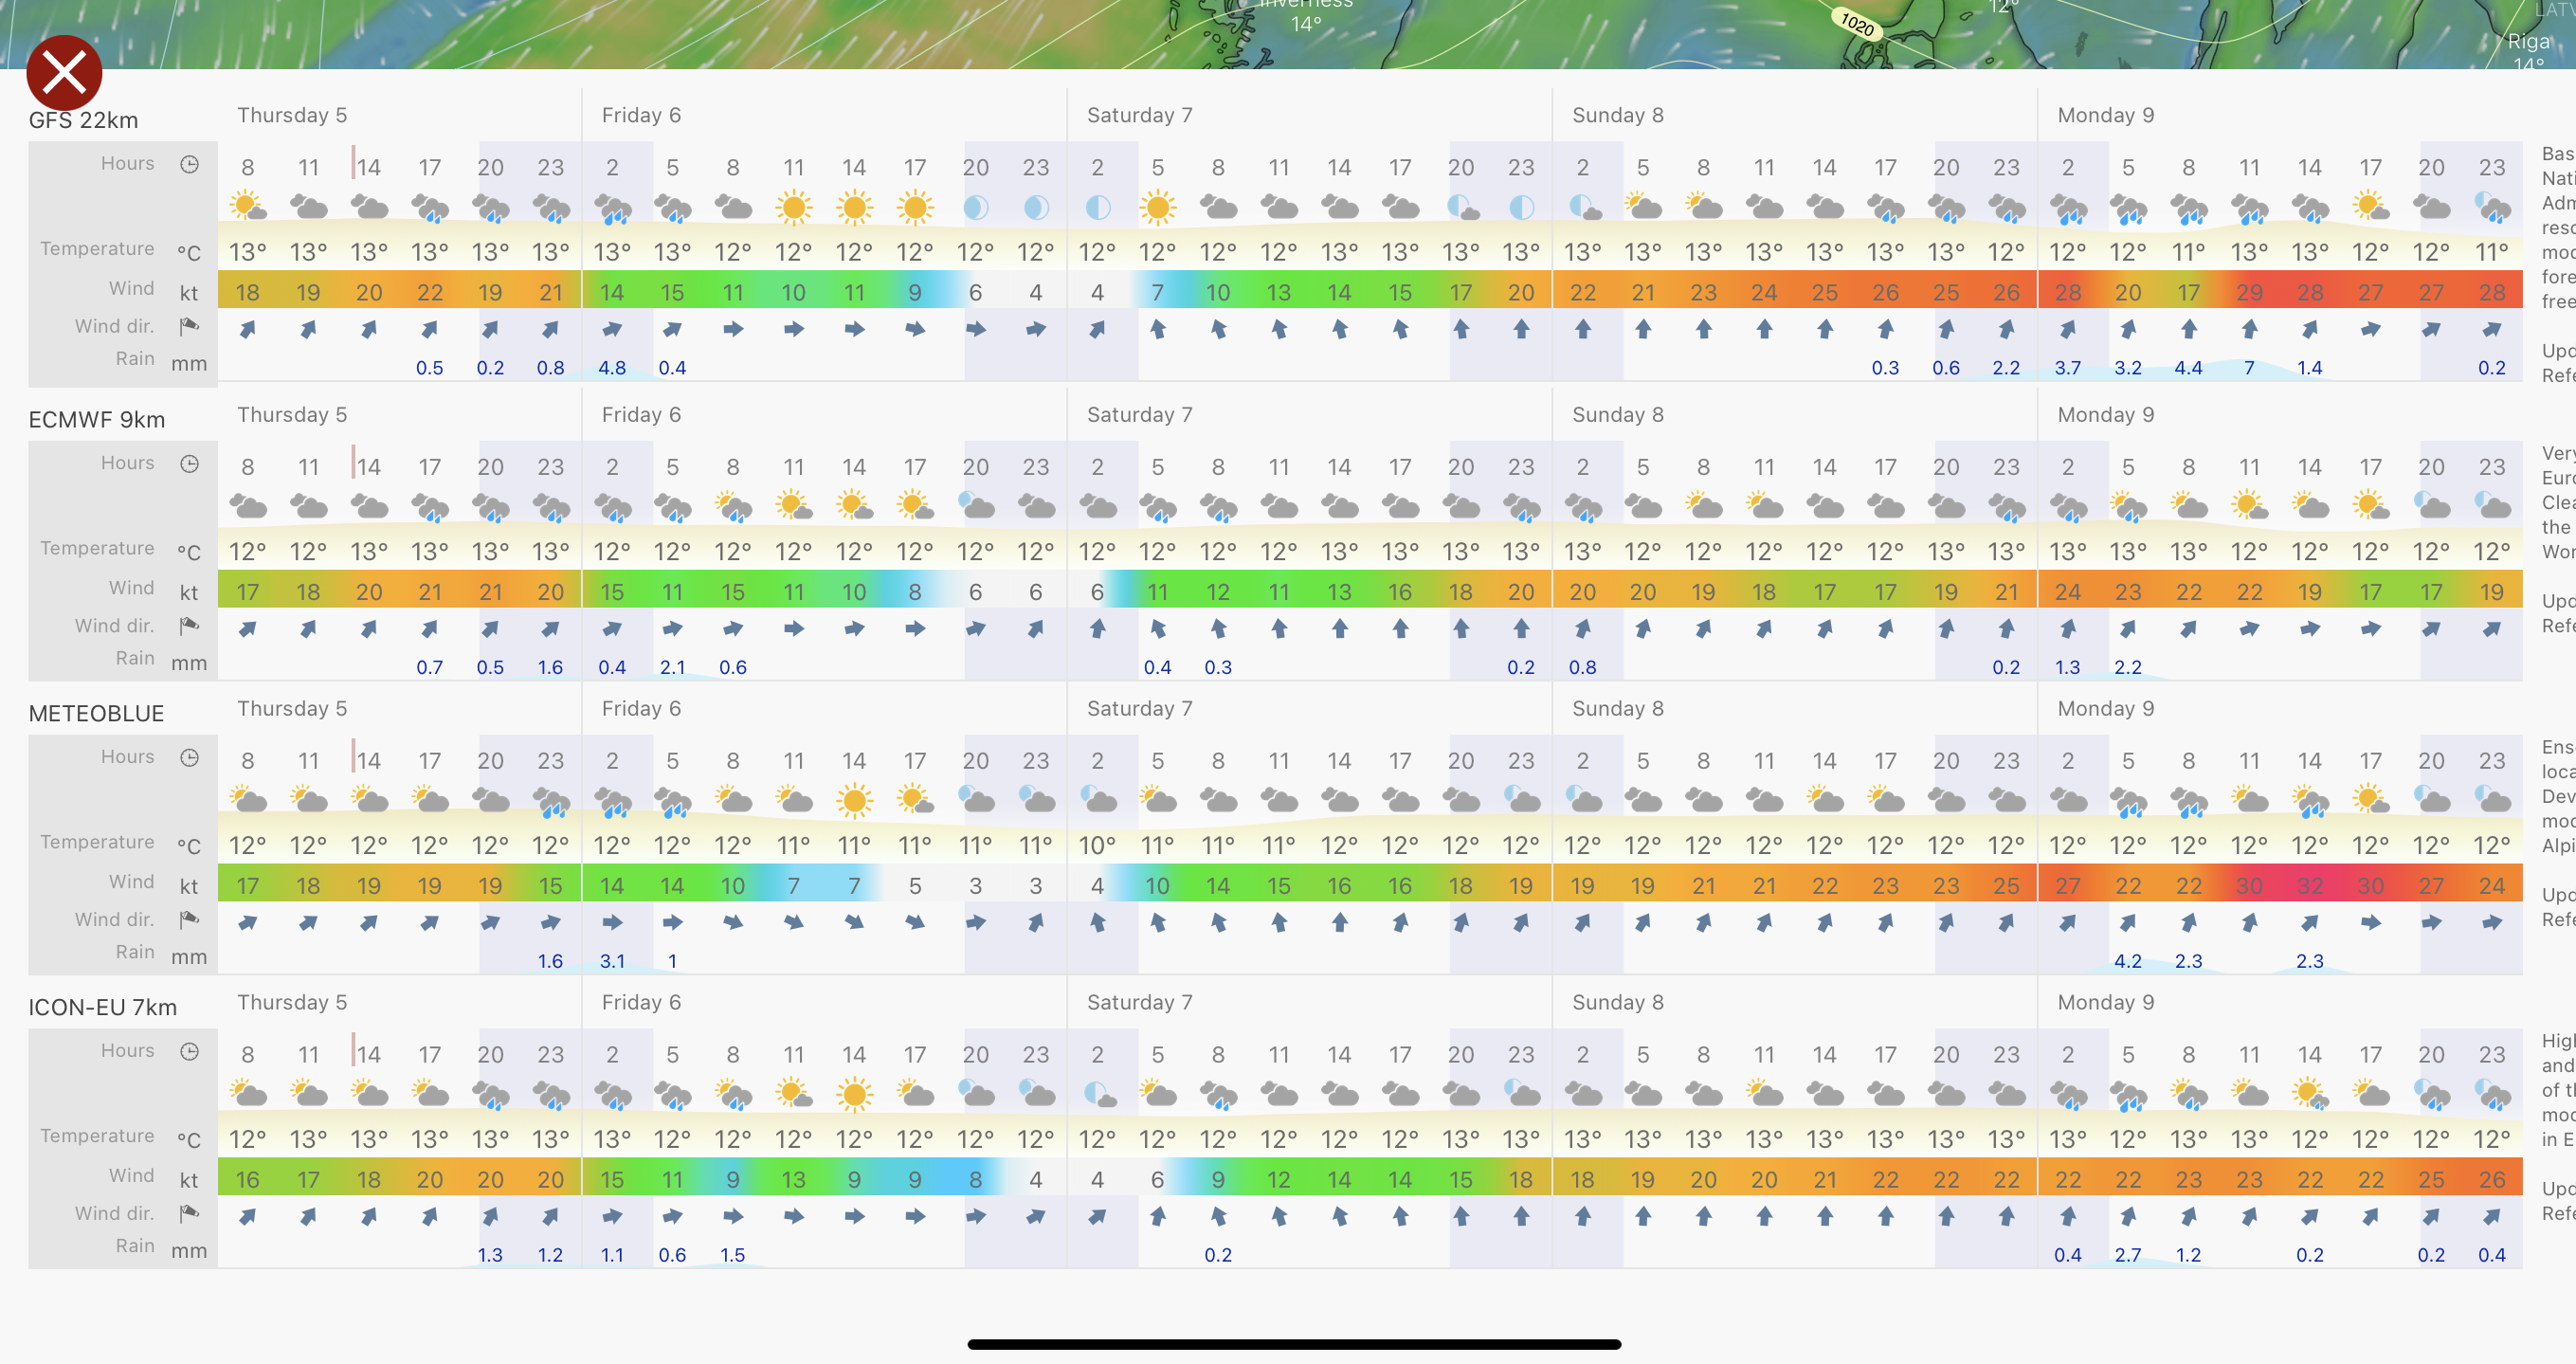
This shows 4 forecasts at point.
Quite often, all values at a particular time are similar, say within about 5 knots of each other. At other times, as in the example shown, there are marked differences. It may be tempting, and is often suggested that the user should take a majority view and discard an outlier. However, even had another two or three models been included, it would be too small an ensemble.
If all the forecasts are similar, it is encouraging. If one is an outlier, it is wisest to trust none. The outlier might be best on the day.
Probability forecasts
A more useful presentation to help sailing decisions is to use the US Navy FNMOC 20-member ensemble. This provides probabilities of winds exceeding certain thresholds for various regions.
You will have to accept conditions here because it is a US military site. No problems, hit Advanced.
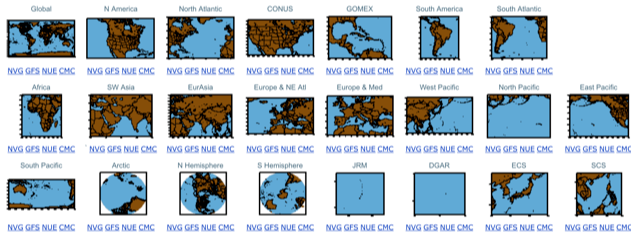
Areas for which forecast probabilities can be obtained from the US GFS.
For each area they provide displays like this.
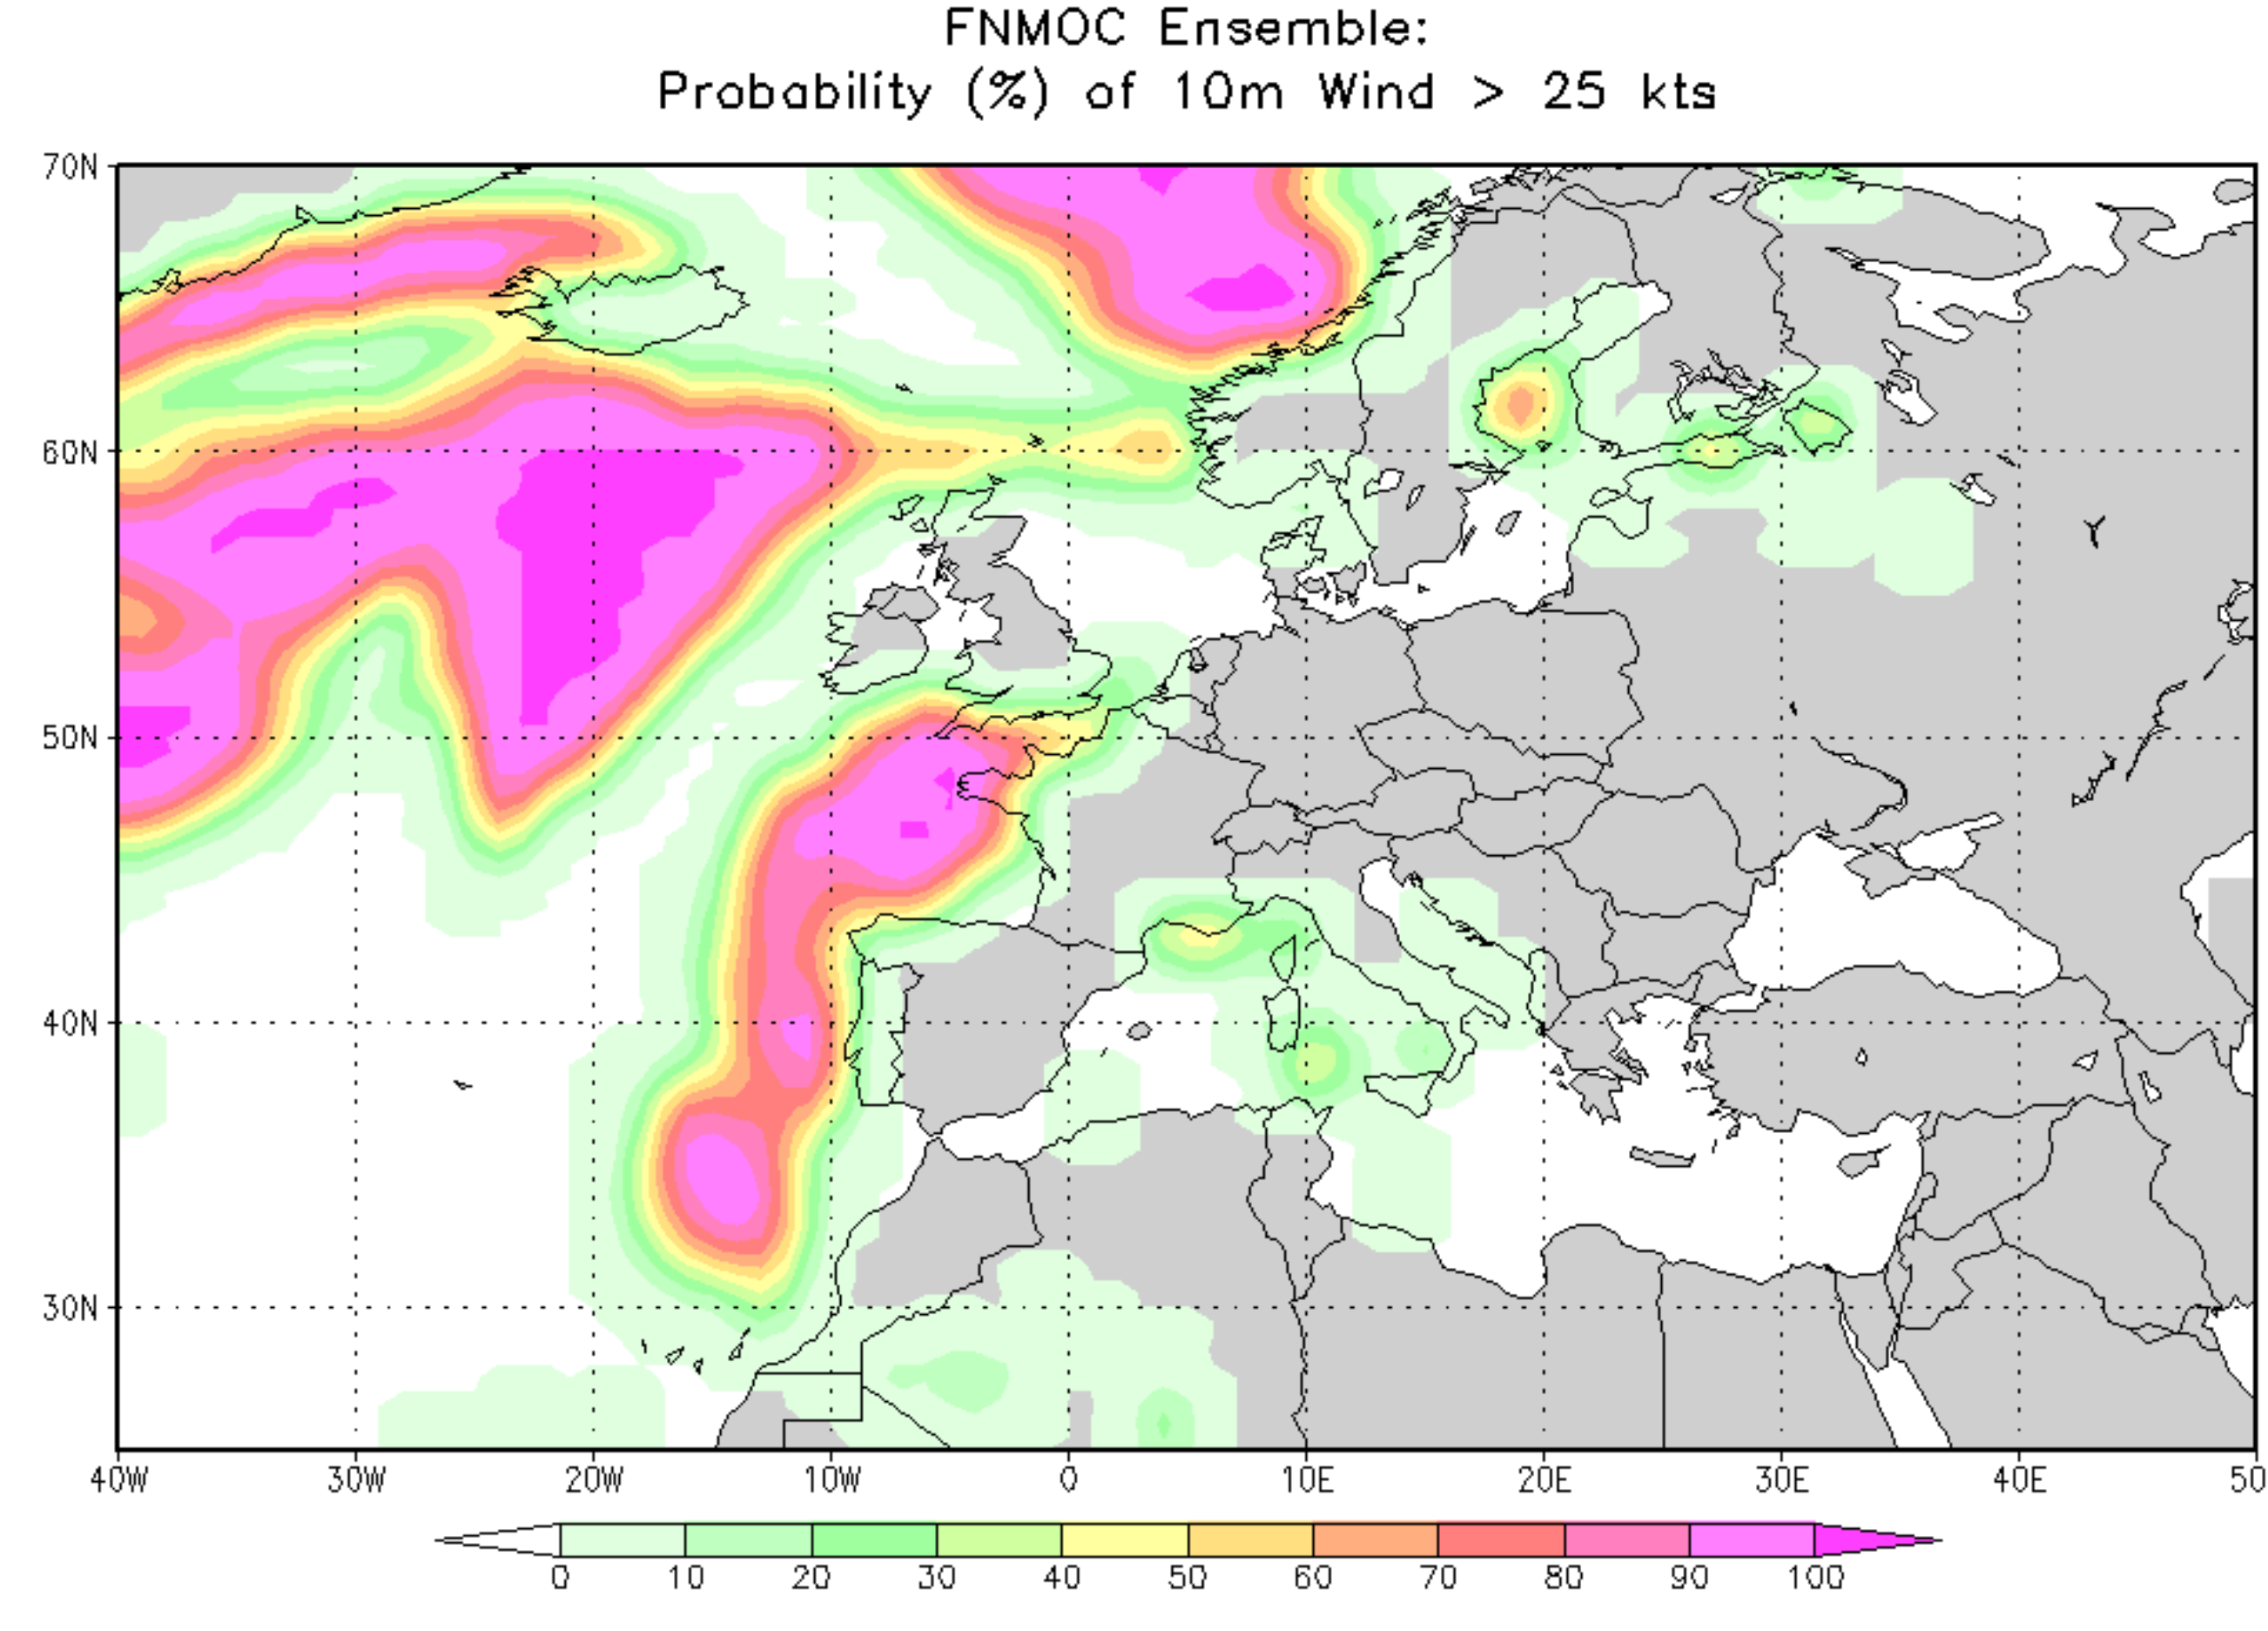
Probabilities of winds >25 knots; other thresholds can be used..
An alternative display is available from the US NOAA Ocean Prediction Center. This superimposes probability data on a chart of isobars over, in this case, the North Atlantic. This may not be as easy to use but gives a good overall view showing how the strong winds relate to the synoptic pattern. .
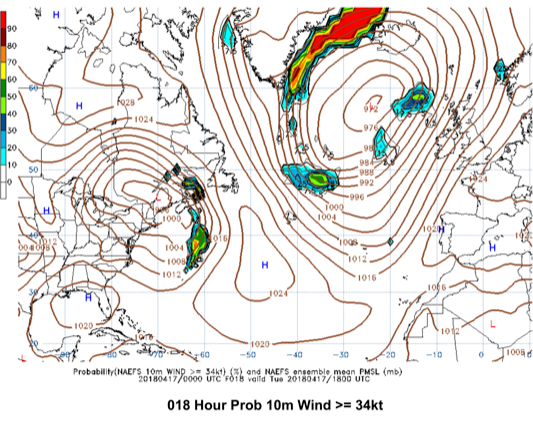
Probability of winds exceeding 34 knots over the North Atlantic.
Model comparison
With global model forecasts becoming available from more sources, inevitably the question arises about which to use. However, there is much interchange of information between modelling groups through WMO. Consequently, differences between models over the first few days are more like an ensemble rather than superiority of one model vis a vis the rest. This is shown here. Unfortunately, the site providing this information has now closed.
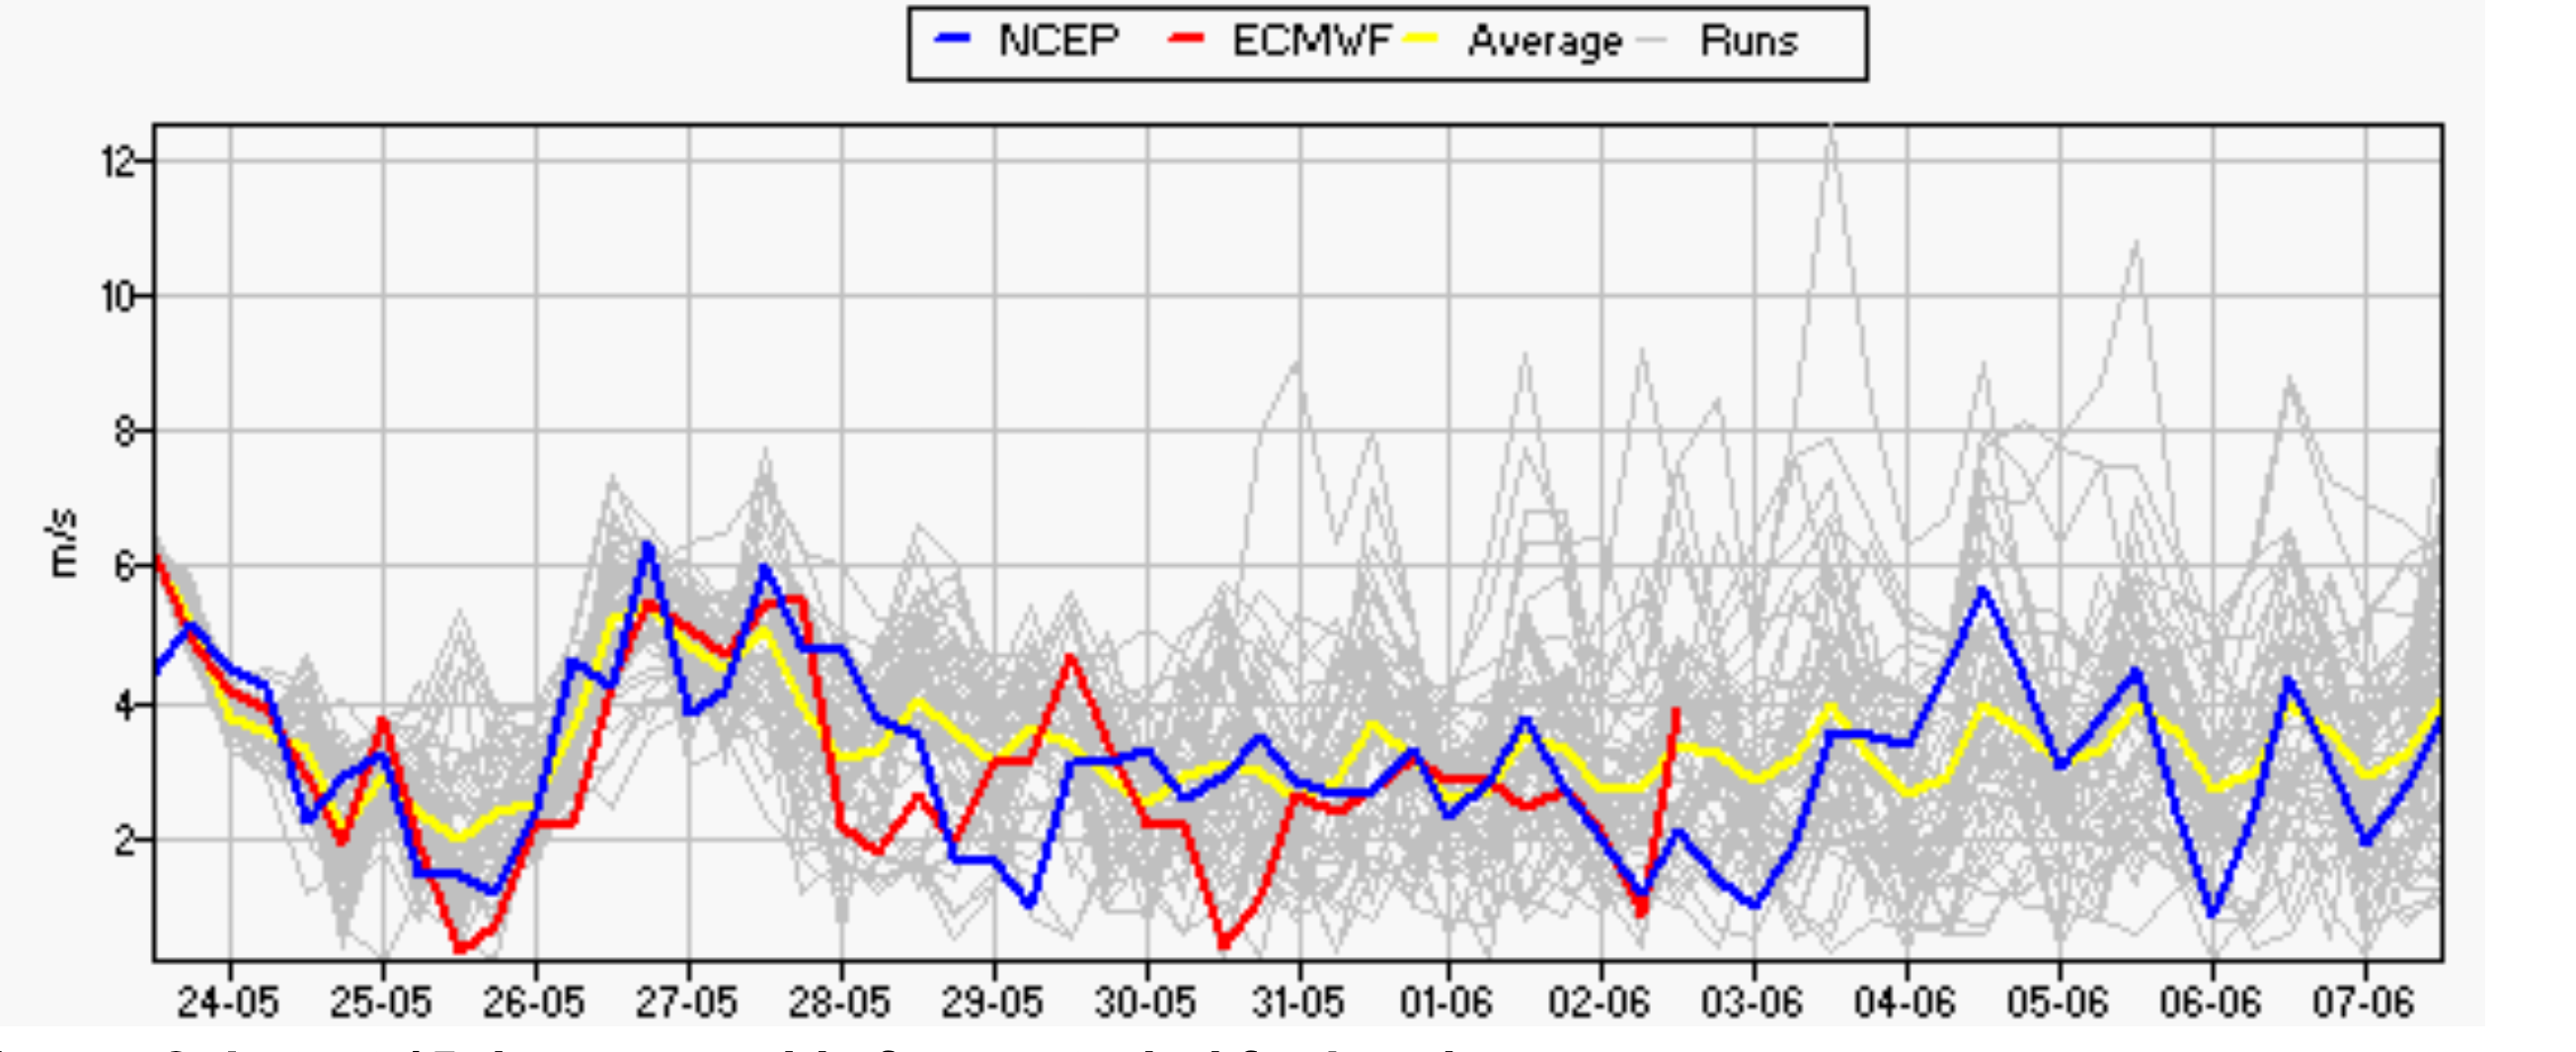
Comparison between deterministic forecasts of wind speed from NCEP (GFS), ECMWF and an average of three models including the CMC. The pale grey lines are the GFS ensemble.
For the first few days there was little to choose between the GFS and ECMWF. Through the first 10 days the ECMWF was within the ensemble range of the GFS. This is fairly typical.